
User story prioritisation is a fundamental aspect of agile development. It helps teams decide which features, enhancements, or fixes to address first, ensuring that the most valuable and critical aspects of a project receive attention. In this newsletter, we’ll look at six frameworks that can help teams at Sage make informed decisions and deliver the most impactful value to users.
RICE Scoring
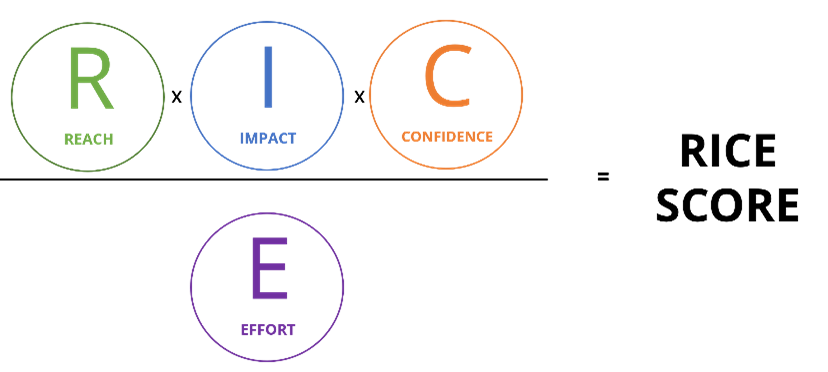
RICE scoring is a prioritisation framework commonly used to evaluate and prioritize projects, features, or initiatives. It helps teams assess and rank potential work items based on four key factors: Reach, Impact, Confidence, and Effort. By assigning scores to each of these factors, teams can make informed decisions about what to prioritise and work on next. Here’s a breakdown of the RICE scoring components:
- Reach: Reach refers to the number of users or customers who will be affected by the project, feature, or initiative. It quantifies the potential audience or user base impacted. You can estimate reach by considering the number of users who will interact with or benefit from the change. Scoring Reach typically involves a numerical estimate. For example, if a feature affects 10% of your user base, you might assign a Reach score of 10.
- Impact: Impact measures the potential value or benefit that the project or feature will bring to the users or the organization. This factor assesses the significance of the change and its potential to drive positive outcomes. Impact scoring often involves a numerical estimate as well. For instance, if a feature is expected to increase revenue by 20%, you might assign an Impact score of 20.
- Confidence: Confidence represents the team’s level of certainty in the Reach and Impact estimates. It takes into account the level of data or research supporting the estimates and the team’s familiarity with the problem. Confidence scores are often assigned as a percentage. If you’re highly confident in your estimates, you might assign a Confidence score of 100%. If you have less confidence, it could be a lower percentage.
- Effort: Effort quantifies the resources, time, and complexity required to implement the project or feature. It considers factors like development time, design work, testing, and any other resources needed. Effort is typically scored numerically, such as assigning a time estimate in hours or days.
To calculate the RICE score for a particular item, you can use the following formula:
RICE Score = (Reach x Impact x Confidence) / Effort
The higher the RICE score, the higher the priority of the item. By utilising RICE scoring, teams can systematically evaluate and prioritise projects or features by considering their potential impact, reach, confidence in estimates, and the effort required. This framework helps ensure that resources are allocated to initiatives that are likely to deliver the most significant value and impact for the organisation or users.
MoSCoW Method
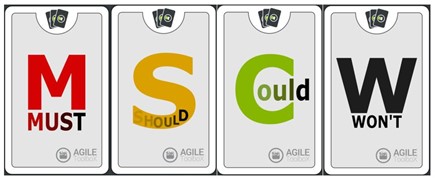
The MoSCoW Method is a well-established technique for prioritizing user stories. The acronym stands for:
- Must-Have: User stories that are essential for the project’s success.
- Should-Have: Important stories but not critical for the project’s immediate success.
- Could-Have: Desirable stories, but not necessary.
- Won’t-Have: Stories that will not be included in the current iteration.
This method helps teams categorise and focus on critical user stories while allowing flexibility for less vital ones.
Weighted Shortest Job First (WSJF)
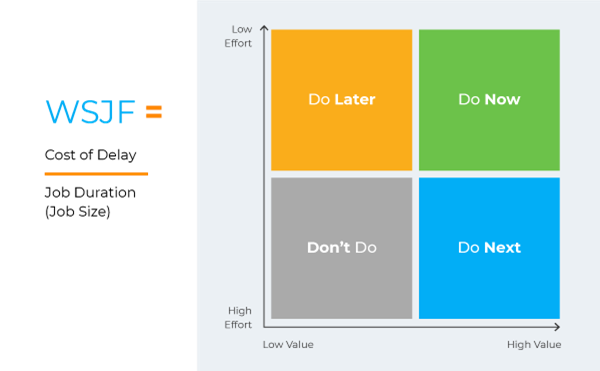
The Weighted Shortest Job First (WSJF) is a prioritization technique used in Agile and Lean software development, particularly within the context of SAFe (Scaled Agile Framework). It’s designed to help teams make informed decisions about which user stories, features, or tasks to work on next by taking into account both the potential value they provide and the effort required to complete them.
WSJF is calculated using the following formula:
WSJF = (CoD + CoR) / Job Size
Where:
CoD (Cost of Delay): This represents the business value or impact that a particular user story or feature will deliver. It measures how much financial loss or opportunity gain would be associated with delaying the implementation of that item.
CoR (Cost of the job in Progress): This factor accounts for the ongoing cost incurred while the job is in progress. It considers aspects such as the operational costs or maintenance expenses that the organisation bears until the task is completed.
Job Size: This refers to the size or effort required to complete the user story or feature. It can be measured in various ways, such as story points in Agile development.
The idea is that the WSJF score helps teams prioritise work based on the potential economic impact (CoD), the cost incurred while waiting (CoR), and the effort needed to complete the task (Job Size). User stories or features with higher WSJF scores are typically prioritised first, as they offer the most significant value relative to the effort and costs involved.
By employing WSJF, teams can make data-driven decisions about what to work on next, ensuring that they focus on the most valuable and cost-effective items, thereby delivering high-impact features to users and customers.
Kano Model
The Kano Model is a framework developed to help businesses understand and prioritise customer needs and preferences. It categorises features, attributes, or elements of a product or service into five distinct categories, each with a different impact on customer satisfaction. The Kano Model is widely used in product development, quality management, and customer experience design.
The five categories in the Kano Model are:
Basic Needs (Must-Have): These are essential features that customers expect as a minimum requirement. If these basic needs are not met, customer dissatisfaction is almost guaranteed. However, fulfilling these requirements typically does not lead to increased customer satisfaction. They are taken for granted.
Performance Needs (Linear): Performance needs are features that correlate directly with customer satisfaction. As the performance of these features improves, customer satisfaction increases. Conversely, if performance decreases, satisfaction decreases as well. These features are often explicitly stated by customers.
Excitement Needs (Delighters): Excitement needs are unexpected or surprising features that have the potential to delight customers. When these features are present, they can significantly boost customer satisfaction, but their absence doesn’t necessarily lead to dissatisfaction. Customers often do not express these desires because they haven’t experienced them before.
Indifferent Needs (Neutral): Indifferent needs are features that do not strongly impact customer satisfaction. Customers are generally neutral about them. The presence or absence of these features doesn’t significantly affect overall satisfaction.
Reverse Needs (Unwanted): Reverse needs are features that, when present, can lead to customer dissatisfaction. These features may not align with customer expectations or preferences, and their inclusion can have a negative impact.
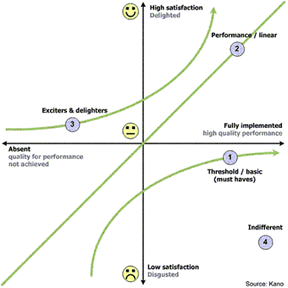
The Kano Model helps product developers and managers understand the relationship between features and customer satisfaction, guiding decisions about which features to prioritize in product design and development. By classifying features into these categories, teams can strategically allocate resources to meet basic needs, improve performance needs, and consider adding excitement needs while avoiding features that could lead to reverse needs. This model is valuable for enhancing the user experience and tailoring products or services to customer expectations.
User Story Mapping
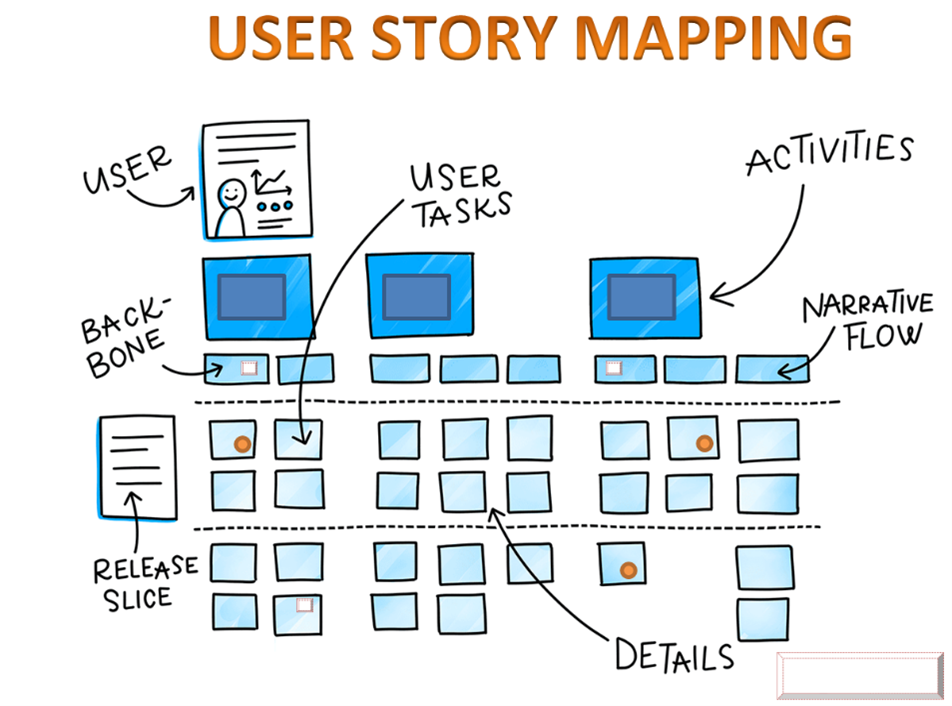
User Story Mapping is an excellent technique for visualising the user journey and organising user stories. By laying out stories in a sequence that aligns with the user’s experience, teams can better understand the logical order in which stories should be developed and delivered. Here’s how user story mapping works:
Identify User Stories: Start by identifying all the user stories or features that need to be addressed in your project. These are typically written from the perspective of the end-user and describe specific functionality or requirements.
Arrange User Stories Horizontally: Arrange the user stories horizontally in a logical sequence to represent the user’s journey or workflow. This can be from the beginning to the end of their interaction with the product or service.
Create Vertical Columns: Create vertical columns to represent the various stages or phases of the user journey. These could be steps in a process, interactions, or even different sections of a software application.
Populate the Map: Place the user stories in the appropriate columns according to where they fit in the user’s journey. User stories in the early columns typically represent initial interactions, while those in later columns are related to more advanced or subsequent steps.
Prioritise and Refine: With the user stories organized, you can now collaboratively prioritize them and discuss the details of each story. This process helps the team gain a shared understanding of the project’s scope and requirements.
Visualize the Flow: The map allows the team to visualize the flow of the project, making it easier to spot gaps, overlaps, and opportunities for improvement. It also helps with identifying the Minimum Viable Product (MVP) and defining what should be delivered in the first iterations.
Iterate and Adjust: As the project progresses, the user story map can be adjusted and refined. New user stories can be added, existing ones can be re-prioritised, and the team can adapt to changing requirements or user feedback.
User story mapping provides a holistic view of the project and ensures that the team remains aligned with the user’s perspective throughout the development process. It is an excellent tool for breaking down complex projects, facilitating communication, and ensuring that the most valuable features and functionality are delivered early in the development process.
Value vs. Effort Matrix
A Value vs. Effort Matrix is a visual tool used for prioritization in project management, product development, and decision-making processes. This matrix helps teams and individuals assess various tasks, features, or projects by considering two critical factors: the potential value or benefit that can be derived from the task and the effort or resources required to complete it.
The matrix typically consists of a two-dimensional grid with the x-axis (horizontal) representing effort or cost and the y-axis (vertical) representing value or benefit. The tasks or items in question are then plotted on the grid according to their estimated value and effort. Here’s a breakdown of the four quadrants in a Value vs. Effort Matrix:
High Value, Low Effort: Items in this quadrant are high-priority tasks. They offer substantial value or benefit relative to the effort required, making them quick wins and top priorities.
High Value, High Effort: Tasks in this quadrant may be important, but they require significant resources or effort to complete. These tasks are usually candidates for long-term planning or consideration in the future.
Low Value, Low Effort: Items in this quadrant typically represent low-priority tasks. They don’t offer significant value relative to the effort needed, so they may be suitable for elimination or automation.
Low Value, High Effort: Tasks in this quadrant are generally not practical. They involve a significant investment of resources but provide minimal value in return, and are often considered for elimination or de-prioritisation.
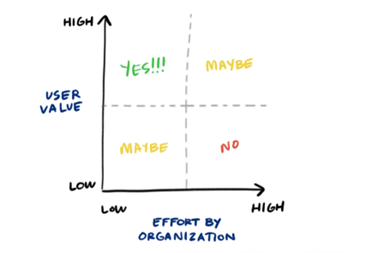
The Value vs. Effort Matrix helps teams prioritize tasks based on their potential return on investment (ROI). High-value, low-effort tasks are immediate candidates for attention, while high-value, high-effort tasks might require careful planning and resource allocation. Tasks with low value relative to effort should be scrutinized and potentially eliminated or automated, and tasks with low value and high effort should be avoided whenever possible. By using this matrix, teams can make informed decisions about where to focus their time, energy, and resources, ensuring that they allocate their efforts to tasks that yield the most significant benefits. It’s a valuable tool for maximizing productivity and efficiency in both project management and product development contexts.
Conclusion
Prioritising user stories is an essential practice for delivering valuable and user-centric solutions in Agile development. Different techniques and frameworks, such as the MoSCoW Method, WSJF, Kano Model, User Story Mapping, and RICE scoring, provide valuable guidance for making these decisions. The choice of which method to use depends on the context and the specific needs of the project. By employing these techniques, teams can streamline their development process, focus on the most critical user needs, and deliver exceptional value to their users.